Kick sampling aquatic macroinvertebrate communities in small streams: is 3 minutes too long, too short, or just right?
By Oliver Longstaffe (1), Andrew Apanasionok (2), Phillipa Bates (1), Lesley Rippon (2*), Simon Rouen (1), Romain Sarremejane (1) and Rachel Stubbington (1*)
(1) Nottingham Trent University, Nottingham, UK, (2) Environment Agency, Bristol, UK *Corresponding authors: lesley.rippon@environment-agency.gov.uk; rachel.stubbington@ntu.ac.uk
The authors, led by FBA Fellow Rachel Stubbington and her Environment Agency colleague Lesley Rippon, collaborated on a project to develop biomonitoring methods for England’s new Small Streams Network. In particular, we evaluated how well the standard 3-minute kick sampling method characterizes macroinvertebrate assemblages. Here, we report key project findings.
Edited by Rachel Stubbington, Nottingham Trent University
Rachel is both a Fellow of the Freshwater Biological Association and long-standing Editor of FBA articles. If you would like to submit an article for consideration for publication, please contact Rachel at: rachel.stubbington@ntu.ac.uk
Introduction
Small streams dominate the length of UK river networks (Smith and Lyle 1979), and collectively support high biodiversity including rare and specialist species (Meyer et al. 2007). Small streams are strongly influenced by the surrounding land and their ecological condition is thus impacted by human activities, but they are rarely included in biomonitoring programmes. To improve their biomonitoring in England, the Environment Agency are introducing the Small Streams Network (SSN; Fig. 1).
Condition assessment of SSN sites will include biomonitoring of groups including aquatic macroinvertebrates, which are ubiquitous, abundant, biodiverse and have a wide range of taxon-specific environmental preferences. Regulatory agencies including the Environment Agency use 3-minute kick samples to collect macroinvertebrates (Murray-Bligh and Griffiths 2022). This 3-minute duration captures an estimated 62% of the taxa present, a limited but sufficient proportion to assess ecological condition (Furse et al. 1981). However, it is unclear if a 3-minute duration is appropriate for small streams, which can support fewer taxa at lower densities than larger rivers of equivalent condition.

Figure 1. Example sites in the Small Streams Network.
We evaluated the standard, 3-minute kick-sampling method at sites representing the range of habitat conditions, and thus macroinvertebrate communities, in England’s Small Streams Network.
Methods
We sampled macroinvertebrate assemblages at 27 sites (Fig. 2), comprising 24 SSN sites and three small chalk streams (which are included in England’s main River Surveillance Network and thus excluded from the SSN), in March–April 2023. Widths ranged from 30–620 cm (mean ± standard deviation [SD], 152 ± 136 cm), alkalinity from 19–282 mg L-1 CaCO3 (169 ± 77 mg L-1), and altitude from 1–347 m.a.s.l. (114 ± 101 m.a.s.l.). Flow permanence at the 24 SSN sites is poorly characterized; based on <1 year of observations, six sites dry out in summer (i.e. ‘temporary’ sites). One of the small chalk streams is also temporary.

Figure 2. Location of the 27 sampling sites.
At each site, we collected kick samples following Murray-Bligh and Griffiths (2022; Fig. 3), but with 5-min samples collected in 0.5-min subsamples. We collected three replicate samples per site, to characterize within-site variability. The ten 0.5-min subsamples generated enough data points to document taxa accumulation in relation to sampling duration.
In the lab, we identified macroinvertebrates to family level, except for Oligochaeta, which we identified as such. We counted each taxon represented by few individuals and estimated the abundance of taxa present at higher densities.
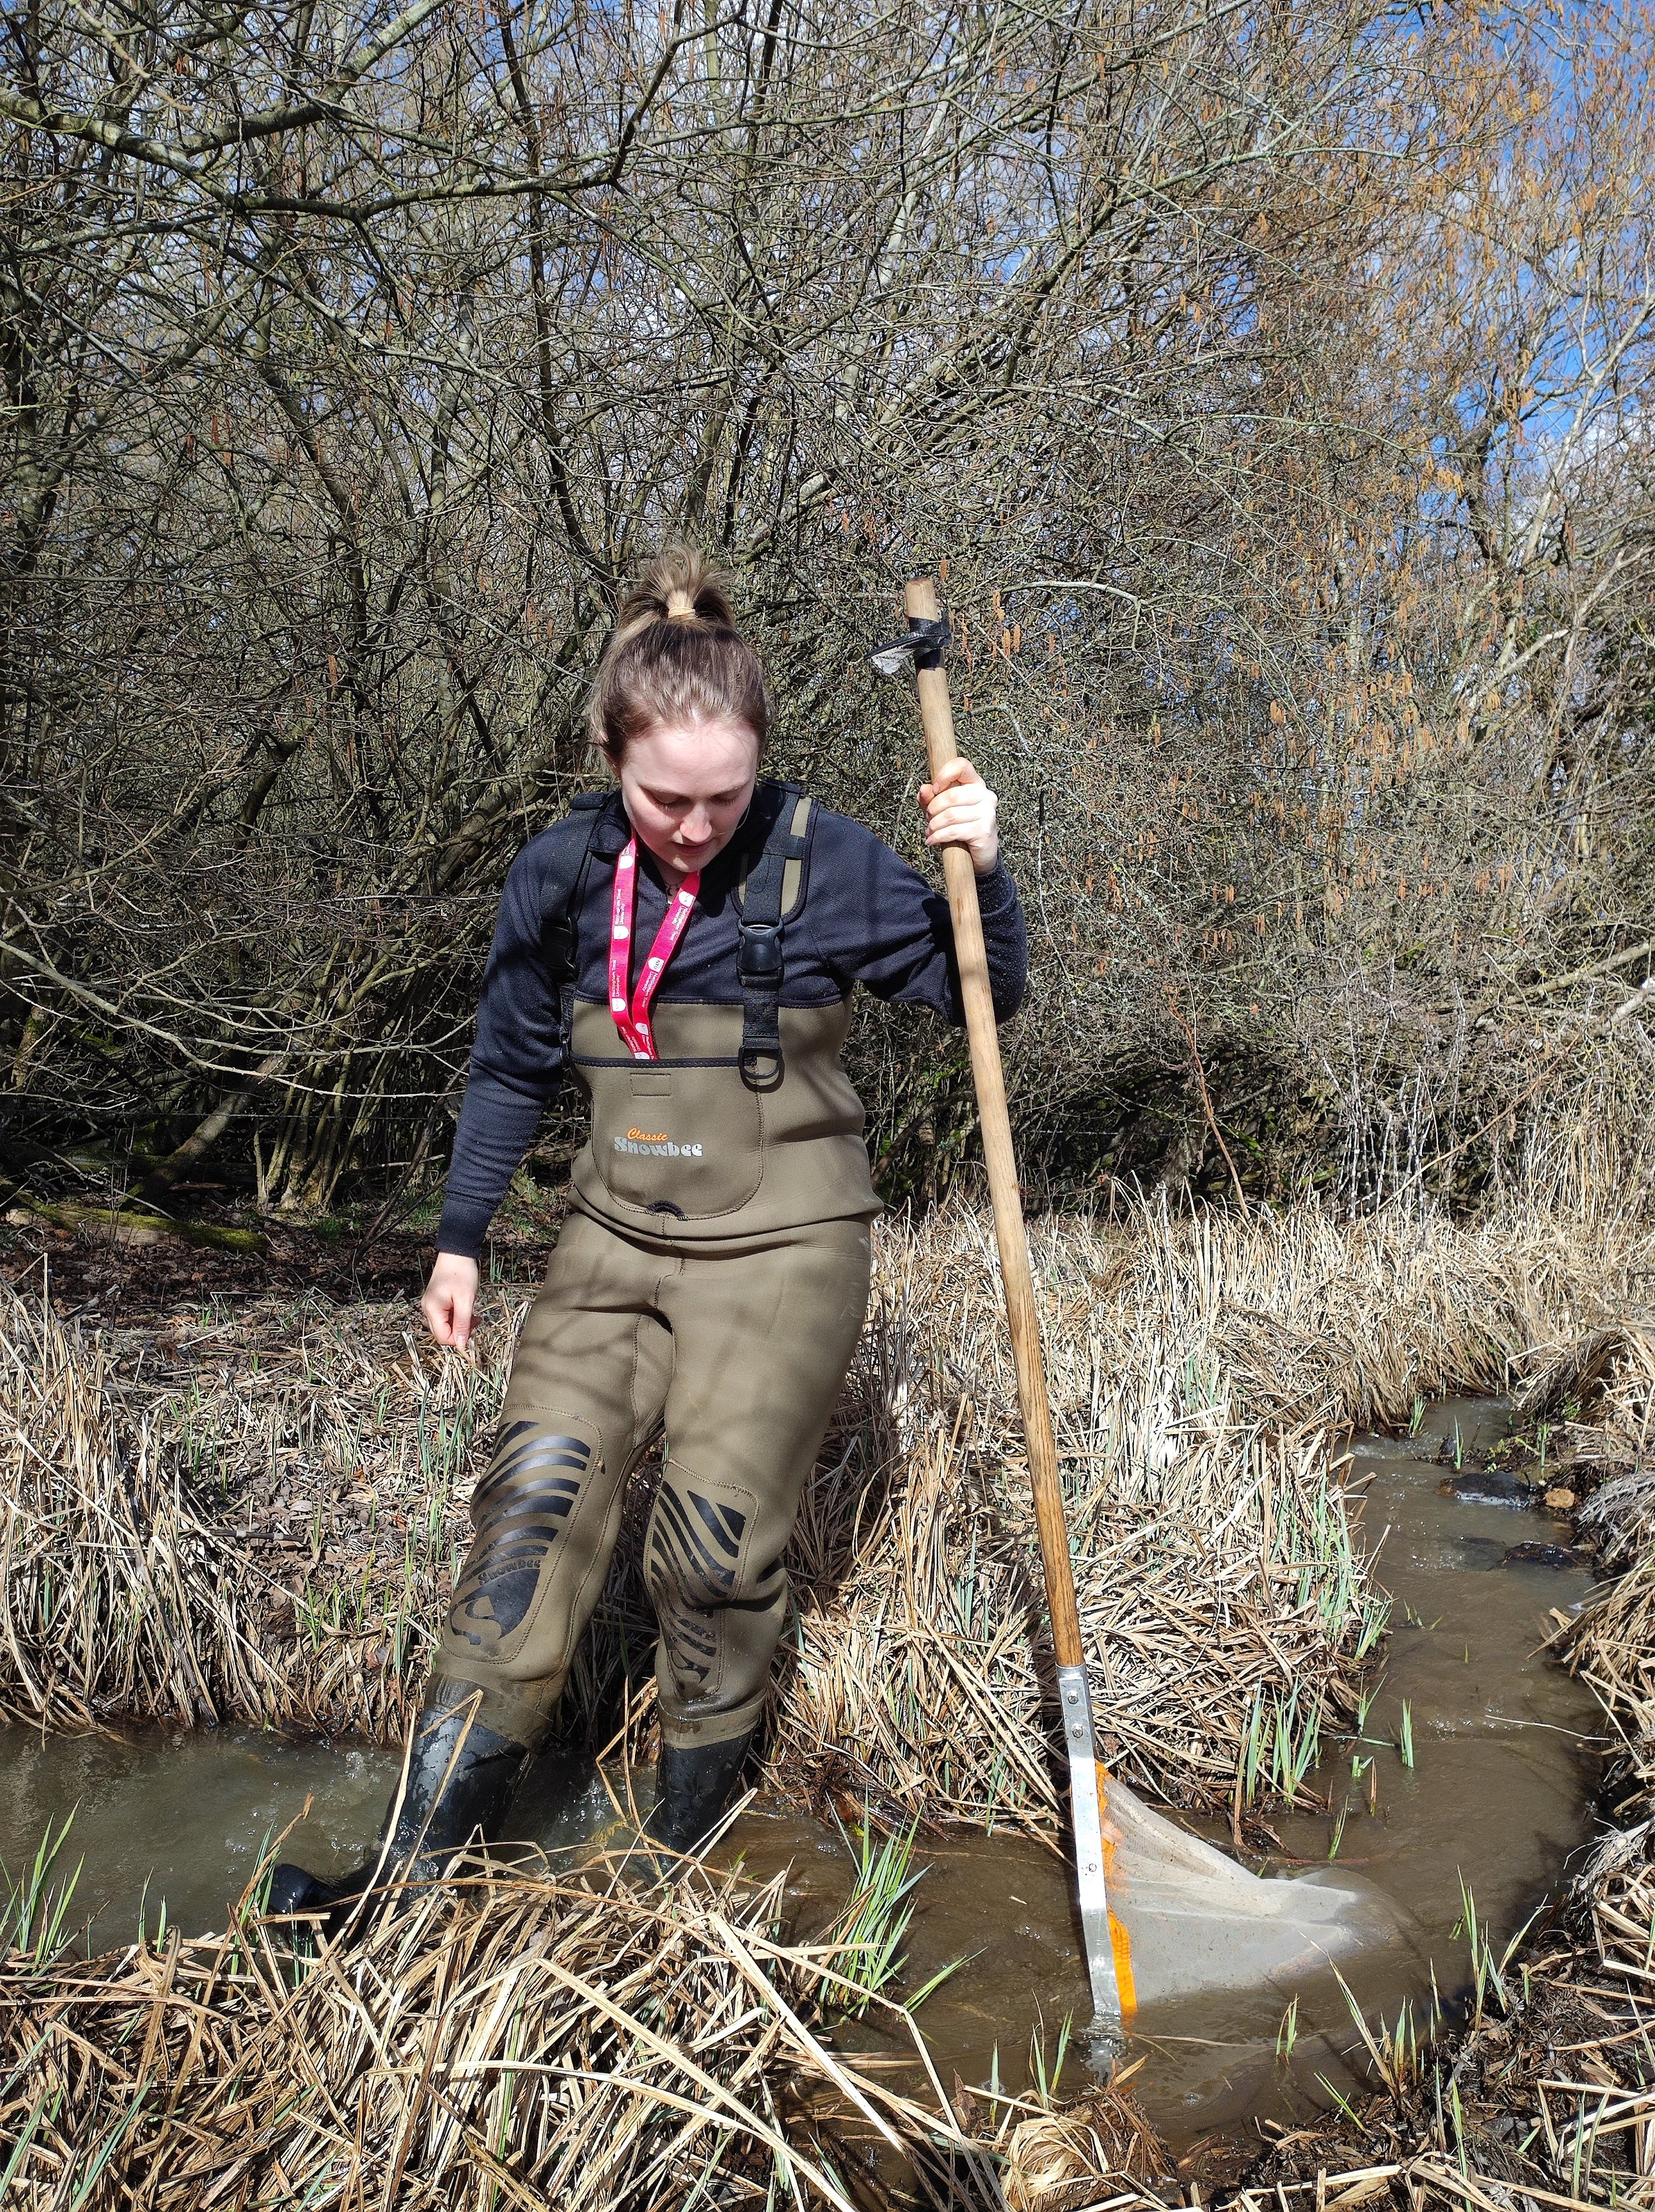
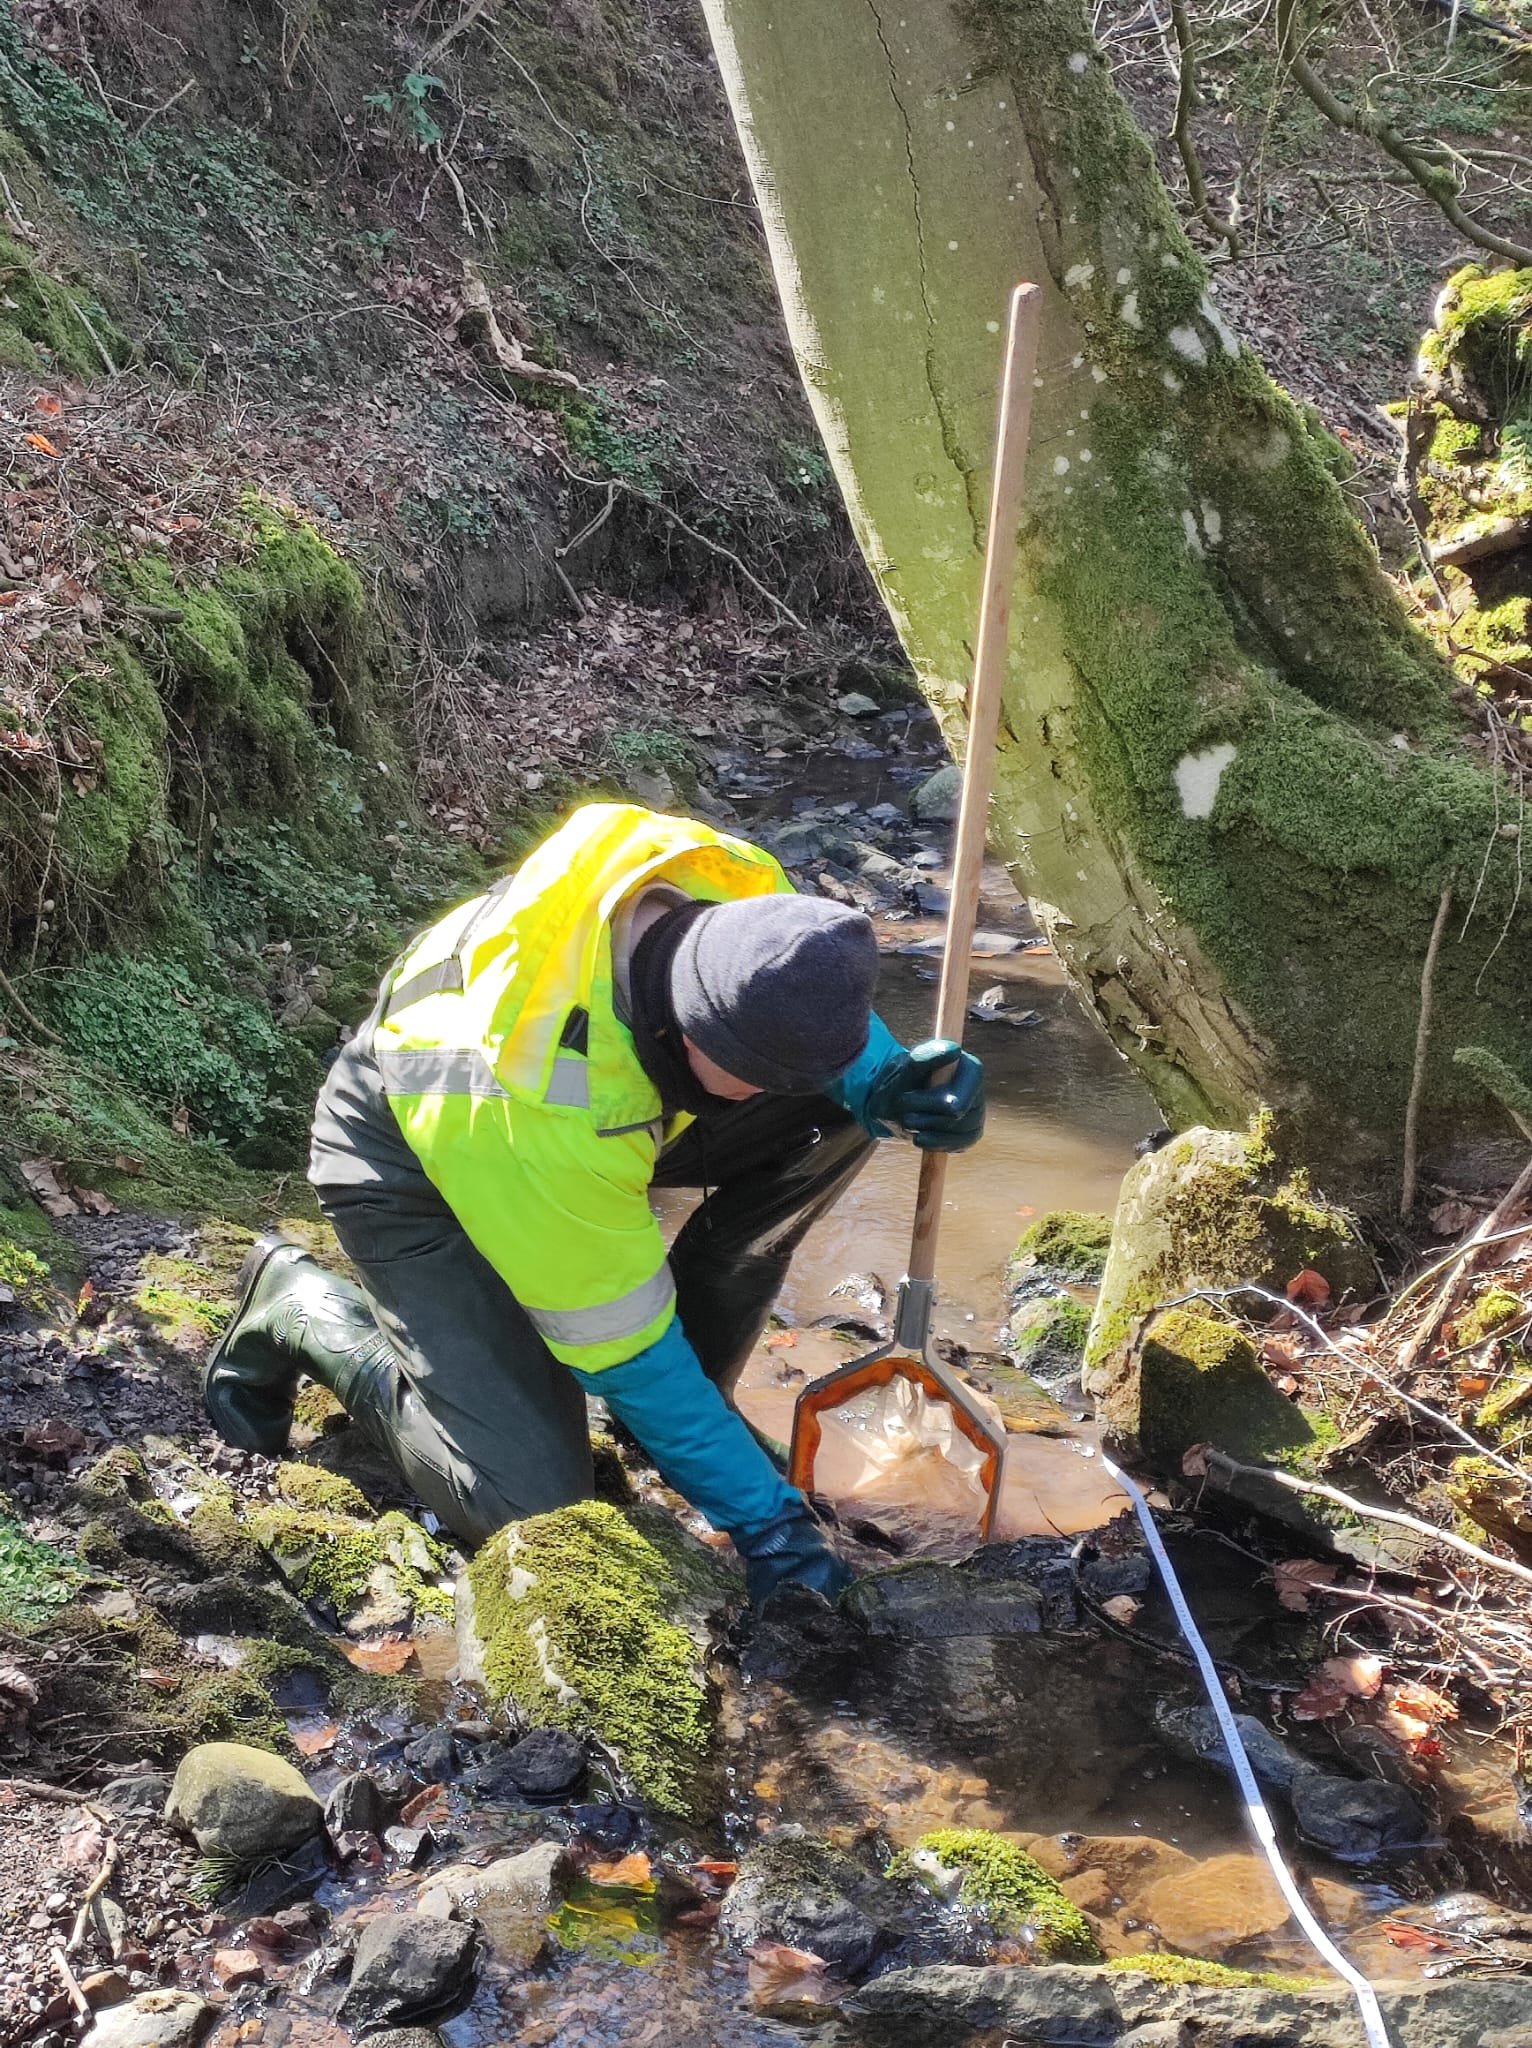
Figure 3. Kick sampling: (left) the standard approach and (right) by hand in a shallow stream.
For each site, we calculated two metrics to represent the macroinvertebrate assemblage: the number of WHPT scoring taxa (hereafter, #NTAXA) and the present-only WHPT-ASPT (average score per taxon, an index of general environmental degradation; Paisley et al. 2014).
We used the taxa within all three replicate samples (i.e. collected in 15 min) to represent the total taxa at a site. Furse et al. (1981) used the taxa in 18-min kick samples to estimate that 3-min samples capture 62% of the families present. To compensate for our shorter total sampling duration, we set 65% as our target %, which would enable comparison of the condition of SSN and larger river sites.
We calculated the mean ± SD #NTAXA and the % of the total (15-min) #NTAXA (hereafter, %NTAXA) captured after each 0.5-min timepoint, based on the cumulative number of scoring taxa present, i.e. those in a subsample and/or the preceding subsamples. This preliminary analysis found that 65.2 ± 10.2% NTAXA (i.e. values closest to the 65% target) were captured after 2.5 min (Fig. 4). We ran linear mixed-effects models to determine if the %NTAXA differed between 2.5-min samples and other durations.

Figure 4. The % of all (i.e. based on the 15-min catch) WHPT scoring taxa (%NTAXA) captured in cumulative 0.5-min subsamples of the 27 5-min kick samples (n = 81). The dashed line represents the 65% target.
To identify the timepoint in the 5-min sample at which WHPT-ASPT stabilized, we first calculated the cumulative WHPT-ASPT after each 0.5-min timepoint. We ran this analysis including all 81 (27 × 3) replicate samples based on the order in which subsamples were collected. We identified the timepoint at which the mean and SD were both <0.1 from the final (5-min) mean and SD. This 0.1 value is arbitrary but is likely to be sufficiently conservative to avoid misinterpretation of ecological condition.
Results
The mean ± SD %NTAXA (and #NTAXA) per sample increased from 38 ± 8.8% (12 ± 4.5 taxa) after 0.5 min to 78 ± 11% (23 ± 7.4) after 5 min, with 68 ± 10% (21 ± 6.8) captured after 3 min (Fig. 5). A minimum of 1 min and a maximum of >5 min was required to capture 65% NTAXA. The %NTAXA captured after 2.5 min differed from that captured after all other sampling durations (p <0.001), including the 3-min duration, which captured 3.2% more %NTAXA and 0.9 more #NTAXA.

Figure 5. The cumulative number of WHPT scoring taxa (#NTAXA) captured in 0.5-min subsamples of 5-min kick samples (n = 81).
WHPT-ASPT increased from 5.17 ± 1.29 after 0.5 min to 5.54 ± 1.09 after 5 min (Fig. 6). The WHPT-ASPT stabilized (i.e. the mean and SD were both <0.1 from the 5-min value) after 2.5 min.

Figure 6. Change in WHPT-ASPT over the 5-min sampling duration. Circles represent the mean WHPT-ASPT and error bars represent the difference between mean at that timepoint and the WHPT-ASPT at 5 min.
Discussion
We found that kick sampling for 2.5 minutes captured a comparable percentage of WHPT scoring macroinvertebrate taxa (NTAXA) to that sampled from larger river sites in 3 minutes by Furse et al. (1981), and that WHPT-ASPT stabilized after 2.5 minutes. Three-minute kick samples captured 3.2% more of the taxa present, i.e. approximately 0.9 taxa per sample. As such, 2.5 minutes may collect assemblages that best facilitate comparison of ecological condition in small streams and larger rivers.
However, our target value of 65% of families is based on that which Furse et al. (1981) captured in 3-minute kick samples from four sites on one river in April 1978, and the extent to which Furse et al.’s estimate represents other larger rivers, such as those in England’s River Surveillance Network, is unknown. In addition, considerable variability around any estimate of the number and percentage of taxa captured is introduced by field operators, laboratory staff and operating procedures—not to mention natural spatial and temporal variability in macroinvertebrate communities (see Feeley et al. 2012). Evidencing such variability, in this study, sites with temporary flow regimes supported fewer NTAXA, had lower WHPT-ASPT values, and it took 3 minutes to capture 65% of NTAXA (data not shown). As such, either 2.5 or 3-minute kick samples may be appropriate for the SSN, and would enable comparison of ecological condition in small streams and larger rivers. Three minutes also has the advantage of facilitating integrated analysis of RSN and SSN condition assessments.
We recognize concerns that kick sampling could damage physical habitats and reduce the viability of sensitive macroinvertebrate populations in small streams, but provide no new evidence to support or refute this idea. In implementing the SSN kick-sampling programme, the Environment Agency are working with national experts at Buglife to identify sites supporting sensitive species of conservation concern, and to decide how best to monitor the condition of these sites.
Acknowledgements
We thank lab assistants Abi Halder, Billy Harper-Kane and Shana Hosty, and Alex Laini for analytical support. We thank Craig Macadam for feedback that improved a draft of this article.
Data availability statement
Contact Rachel to request data underpinning this article.
Copyright statement
All figures are © the authors.
References
Feeley, H.B. et al. 2012. Refining a kick sampling strategy for the bioassessment of benthic macroinvertebrates in headwater streams. Hydrobiologia 683: 53–68. https://doi.org/10.1007/s10750-011-0940-9
Furse, M.T. et al. 1981. An appraisal of pond-net samples for biological monitoring of lotic macro-invertebrates. Water Research 15: 679–689. https://doi.org/10.1016/0043-1354(81)90160-3
Meyer, J.L. et al. 2007. The contribution of headwater streams to biodiversity in river networks. Journal of the American Water Resources Association 43: 86–103. https://doi.org/10.1111/j.1752-1688.2007.00008.x
Murray-Bligh, J. and Griffiths, M. 2022. Freshwater Biology and Ecology Handbook. https://fwrinformationcentre.co.uk/biology-and-ecology-handbook/index.html
Paisley, M.F., Trigg, D.J. and Walley, W.J. 2014. Revision of the Biological Monitoring Working Party (BMWP) score system: Derivation of present‐only and abundance‐related scores from field data. River Research and Applications 30: 887–904. https://doi.org/10.1002/rra.2686
Smith, J.J. and Lyle, A. 1979. Distribution of freshwaters in Great Britain. https://nora.nerc.ac.uk/id/eprint/5238/1/Distribution_freshwaters.pdf
Further reading
The Freshwater Biological Association publishes a wide range of books and offers a number of courses throughout the year. Check out our shop here.


Get involved
Our scientific research builds a community of action, bringing people and organisations together to deliver the urgent action needed to protect freshwaters. Join us in protecting freshwater environments now and for the future.