The Riverfly Partnership: looking back on a year of growth, collaboration and development
14 November, 2024
We’re into November and that marks a milestone for the Riverfly Partnership, we have been on our new data platform – Cartographer – for just over a year now.
The past 12 months has seen an inspiring evolution in the Riverfly Partnership, with growth in our full-time team and a transition over to an upgraded database with extended capacity to provide more refined recording and analysis for our supporting organisations and citizen scientists.
The Cartographer database
Adopting a new platform, transferring the existing records (of which there were just over 50,000 at that time), migrating that data and onboarding the volunteers was a mammoth undertaking. Thankfully we were able to recruit two additional team members in 2023 who joined us in September and helped enormously with the smooth database transition.
Photograph of the Riverfly Partnership team, Ellen Burton, Trine Bregstein and Beth Korab, by Windermere in the Lake District, Cumbria.
A year down the line and we now have over 61,000 surveys uploaded (59,546 RMI, 515 Urban, 1342 Extended). One of the major upgrades of our new database is the ability for volunteers to record surveys from our three different modes of monitoring, which our old database was not capable of and that is helping us roll out Urban and Extended monitoring across the network.
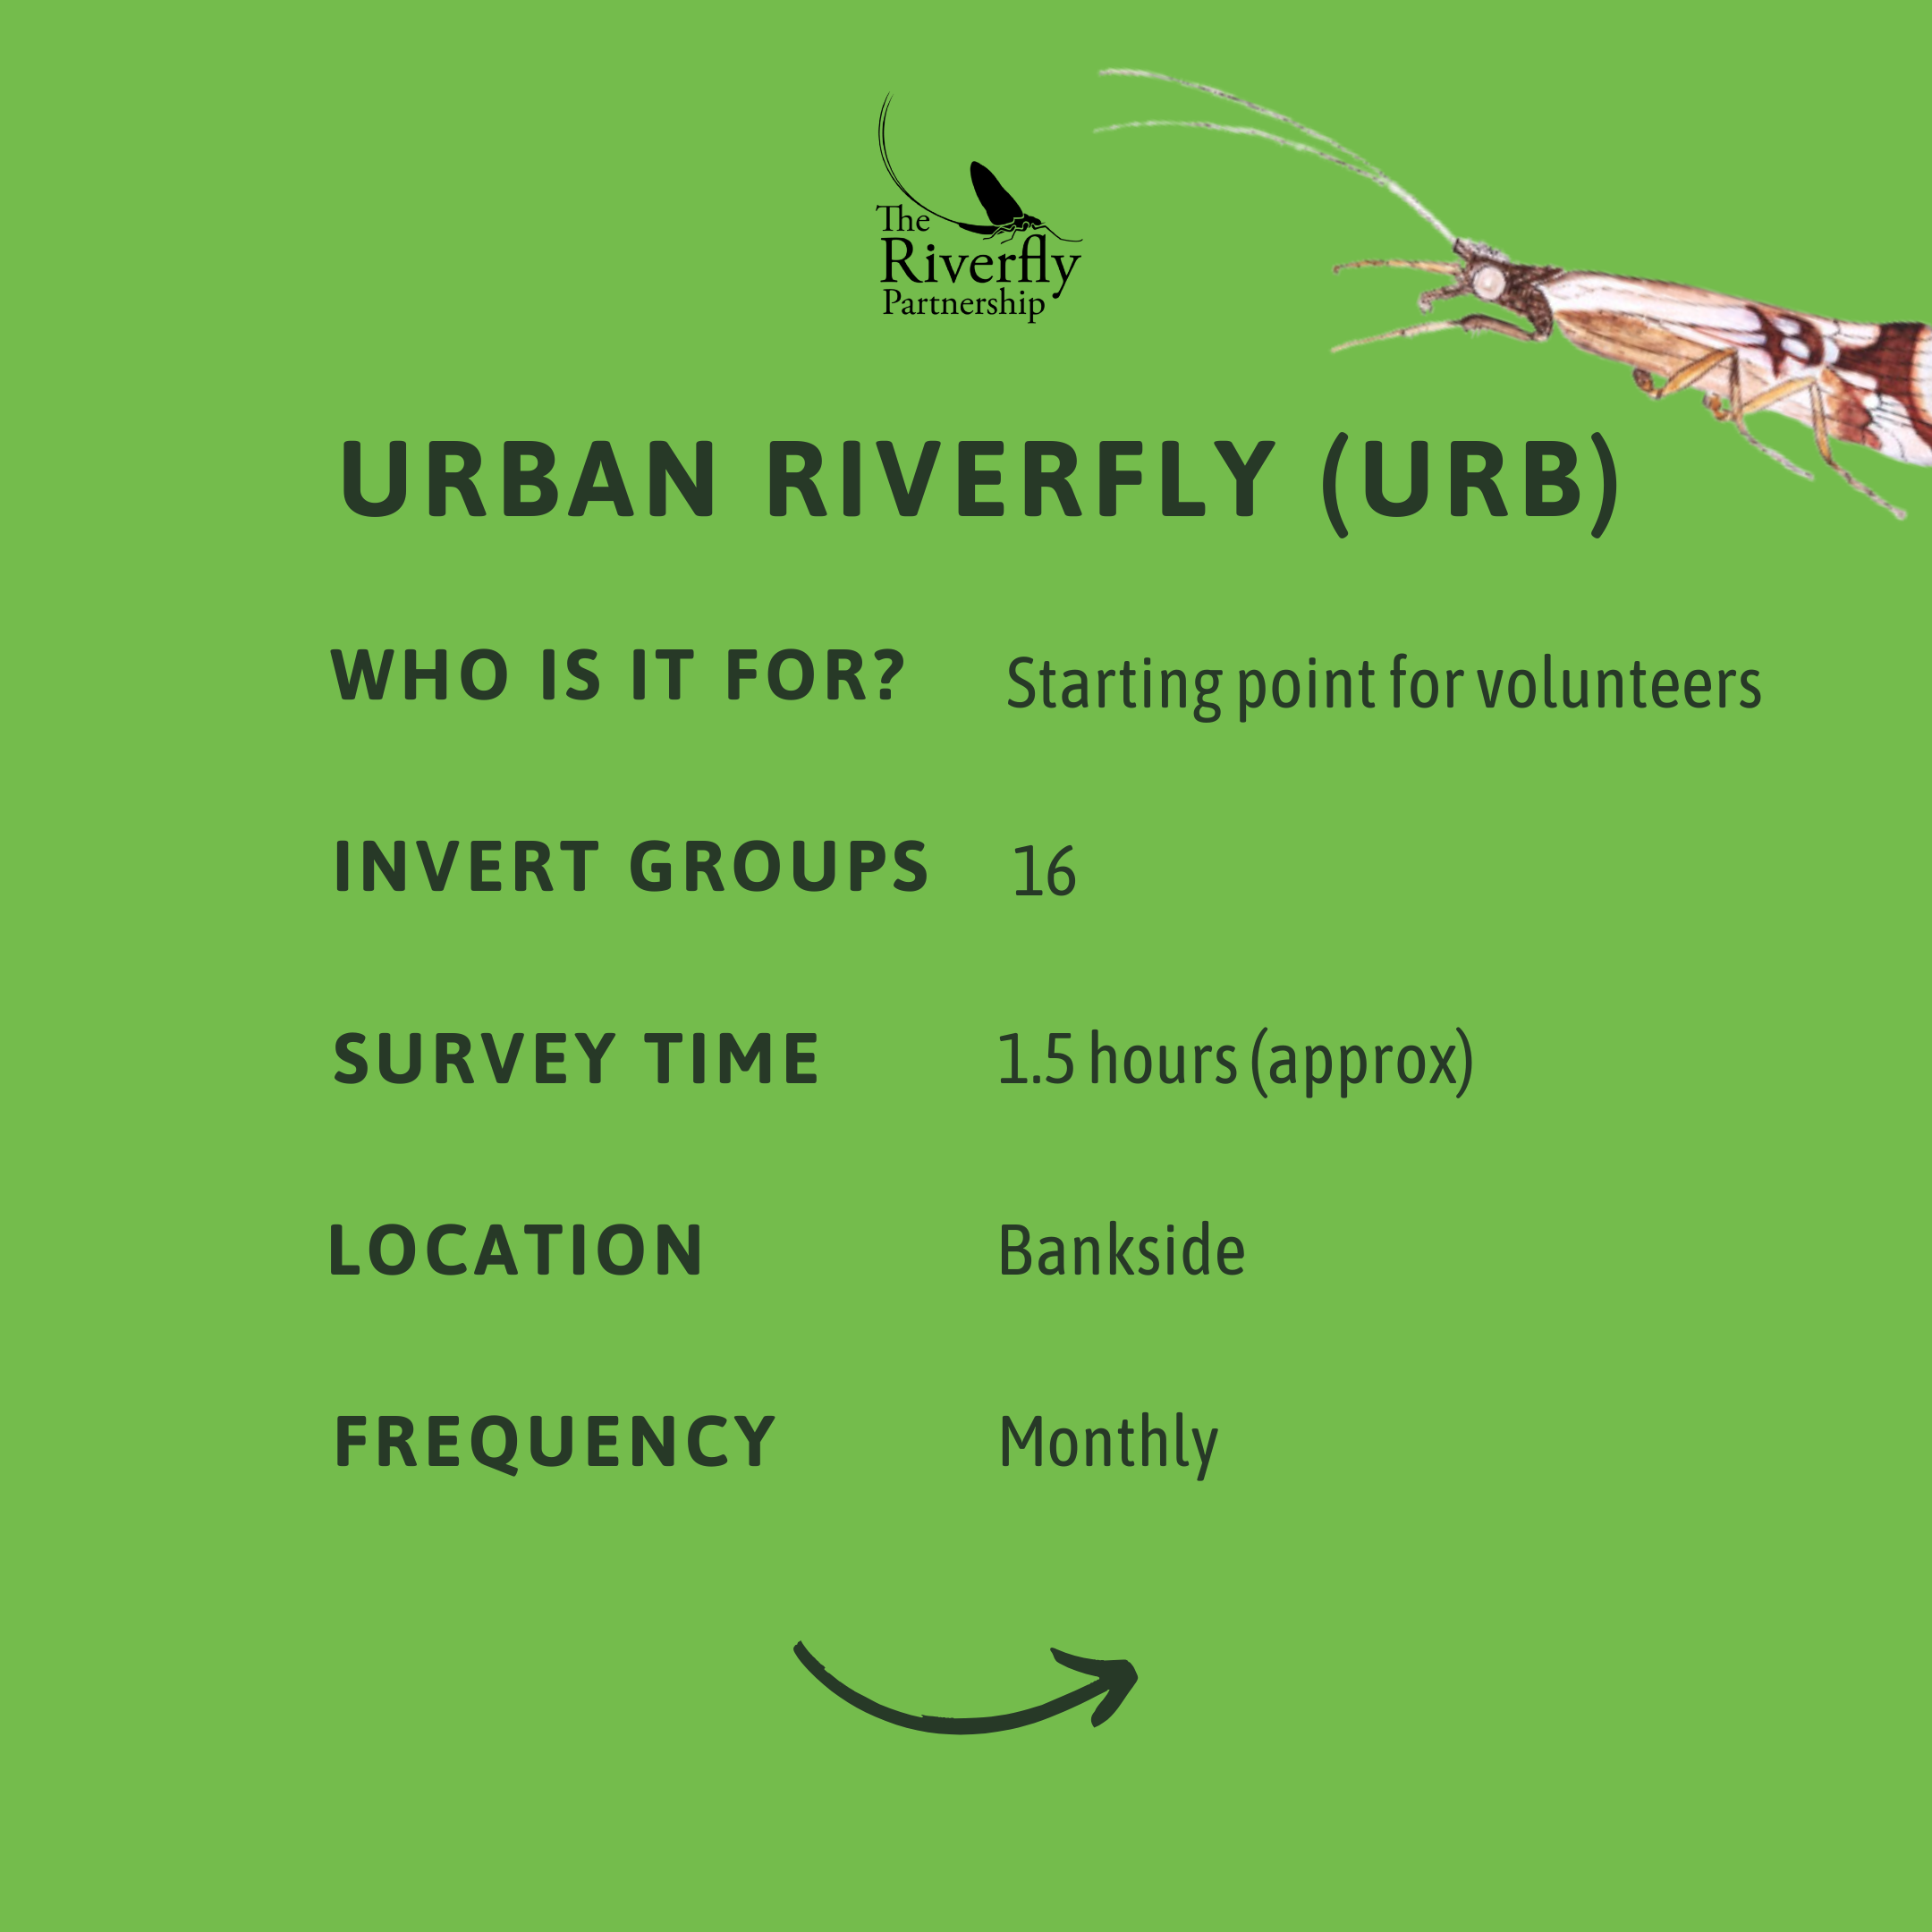
What is the difference between Standard, Urban and Extended Riverfly schemes?


Riverfly Partnership training at the Natural History Museum
This summer we held an Extended Train the Trainers event and accredited a further eleven tutors who are able to upskill existing volunteers to undertake the 33 group Extended method of monitoring. We have also developed an online course for upskilling volunteers to the 14 group Urban method, which we will be sharing with group coordinators soon.
Riverfly Extended Train the Trainers event at the National History Museum
Riverfly Data platform
Though all our data is available openly and freely as downloads from Cartographer, not everyone is a whizz with a spreadsheet, so we had developers at Cartographer create a new data visualisation platform to help display the valuable data collected by the volunteers, it is available at riverflydata.org/.
It is a simple and effective way to dive into the vast data set and produce outputs that you can save as a PDF. You can search by site, river, catchment or team, so you can get a general overview or drill down to site specifics.
Find out more about the Riverfly Partnership
To learn more about what the Riverfly Partnership does you can check the latest Riverfly newsletter where we have shared information from across the network and interesting stats, such as our volunteers having counted over 900,000 freshwater shrimp in our first year on Cartographer — now that is a lot of Gammarus!
If you would like to become a Citizen Scientist and support freshwater ecosystems by monitoring a local river, you can find out more on the Riverfly Partnership website.


What’s next for the Riverfly Partnership?
Looking forward we want to increase connectivity across the vast network of volunteers and really showcase how valuable the data can be, not just in detecting pollution events but also as part of restoration projects, catchment monitoring plans, bringing communities together through monitoring action and inspiring more people to care about their blue spaces and the invertebrates that live in them.
We are looking forward to a year of collaboration with initiatives such as CaSTCo, where demo catchments are using Riverfly monitoring as part of a suite of complementary citizen science based water quality monitoring schemes, and of course with our funders the Environment Agency who are supporting citizen science.
“The last year has been a real whirlwind, expanding the team to three full time members of staff has given us the capacity to really grow, develop and refine our offering for the citizen science community we serve. Launching the Cartographer database and our data visualisation platform has been a huge achievement. The last twelve months have been really good for the Riverfly Partnership, and we are excited by things to come!”
Many thanks to the Environment Agency and Esmée Fairbairn Foundation for being our generous funders and supporting the work we do.


